

Why Fidus?
Outgrowing spreadsheets, but not ready for a full ETRM?
Fidus Analytics delivers custom energy analytics solutions — without the heavy costs, long lead times, or complexity of traditional platforms.
The Challenge
Traditional ETRMs demand heavy upfront investment, lengthy deployment cycles, and scarce IT resources - putting enterprise-level analytics out of reach for energy businesses that need results now, not next year.
Your business is unique — your analytics should be too
Every energy business has unique reporting, trading, and insight requirements. Most ETRM platforms offer one-size-fits-all solutions that take companies only partway to their goals, leaving critical needs unmet.
Enterprise tools without the enterprise overhead
Energy businesses today face a common dilemma: spreadsheets can't handle the complexity, but traditional ETRM systems are overkill. Sound familiar? You're not alone in facing these challenges.
Disconnected data limits proactive insight
Your teams spend valuable time gathering and reconciling data from multiple sources just to meet basic reporting needs. That leaves little capacity for the strategic analysis that actually drives trading performance and competitive advantage.
Spreadsheets aren’t a scalable strategy
Critical analytics locked in spreadsheets create calculation errors, version conflicts, and dangerous single points of failure. This makes it hard to trust your data today — and impossible to scale your insights as your business grows.
Whether you're a trading desk, energy generator, or managing supply contracts across gas and power markets, these barriers are likely holding your business back.
See the Spark Platform in Action
Explore how we transform scattered data into unified insights. This generator portfolio demo shows how your team can track market risk, performance, and profitability in near real-time.
We build similar platforms for demand flex, fixed price, and gas portfolios. Interact directly on desktop, or click here for mobile viewing.
Endless possibilities, driven by your vision.
Our flexible analytics solutions grow with you — if you can imagine it, we can build it.
Core Platform Capabilities
Every feature can be customised to match your specific workflows, data sources, and business requirements.
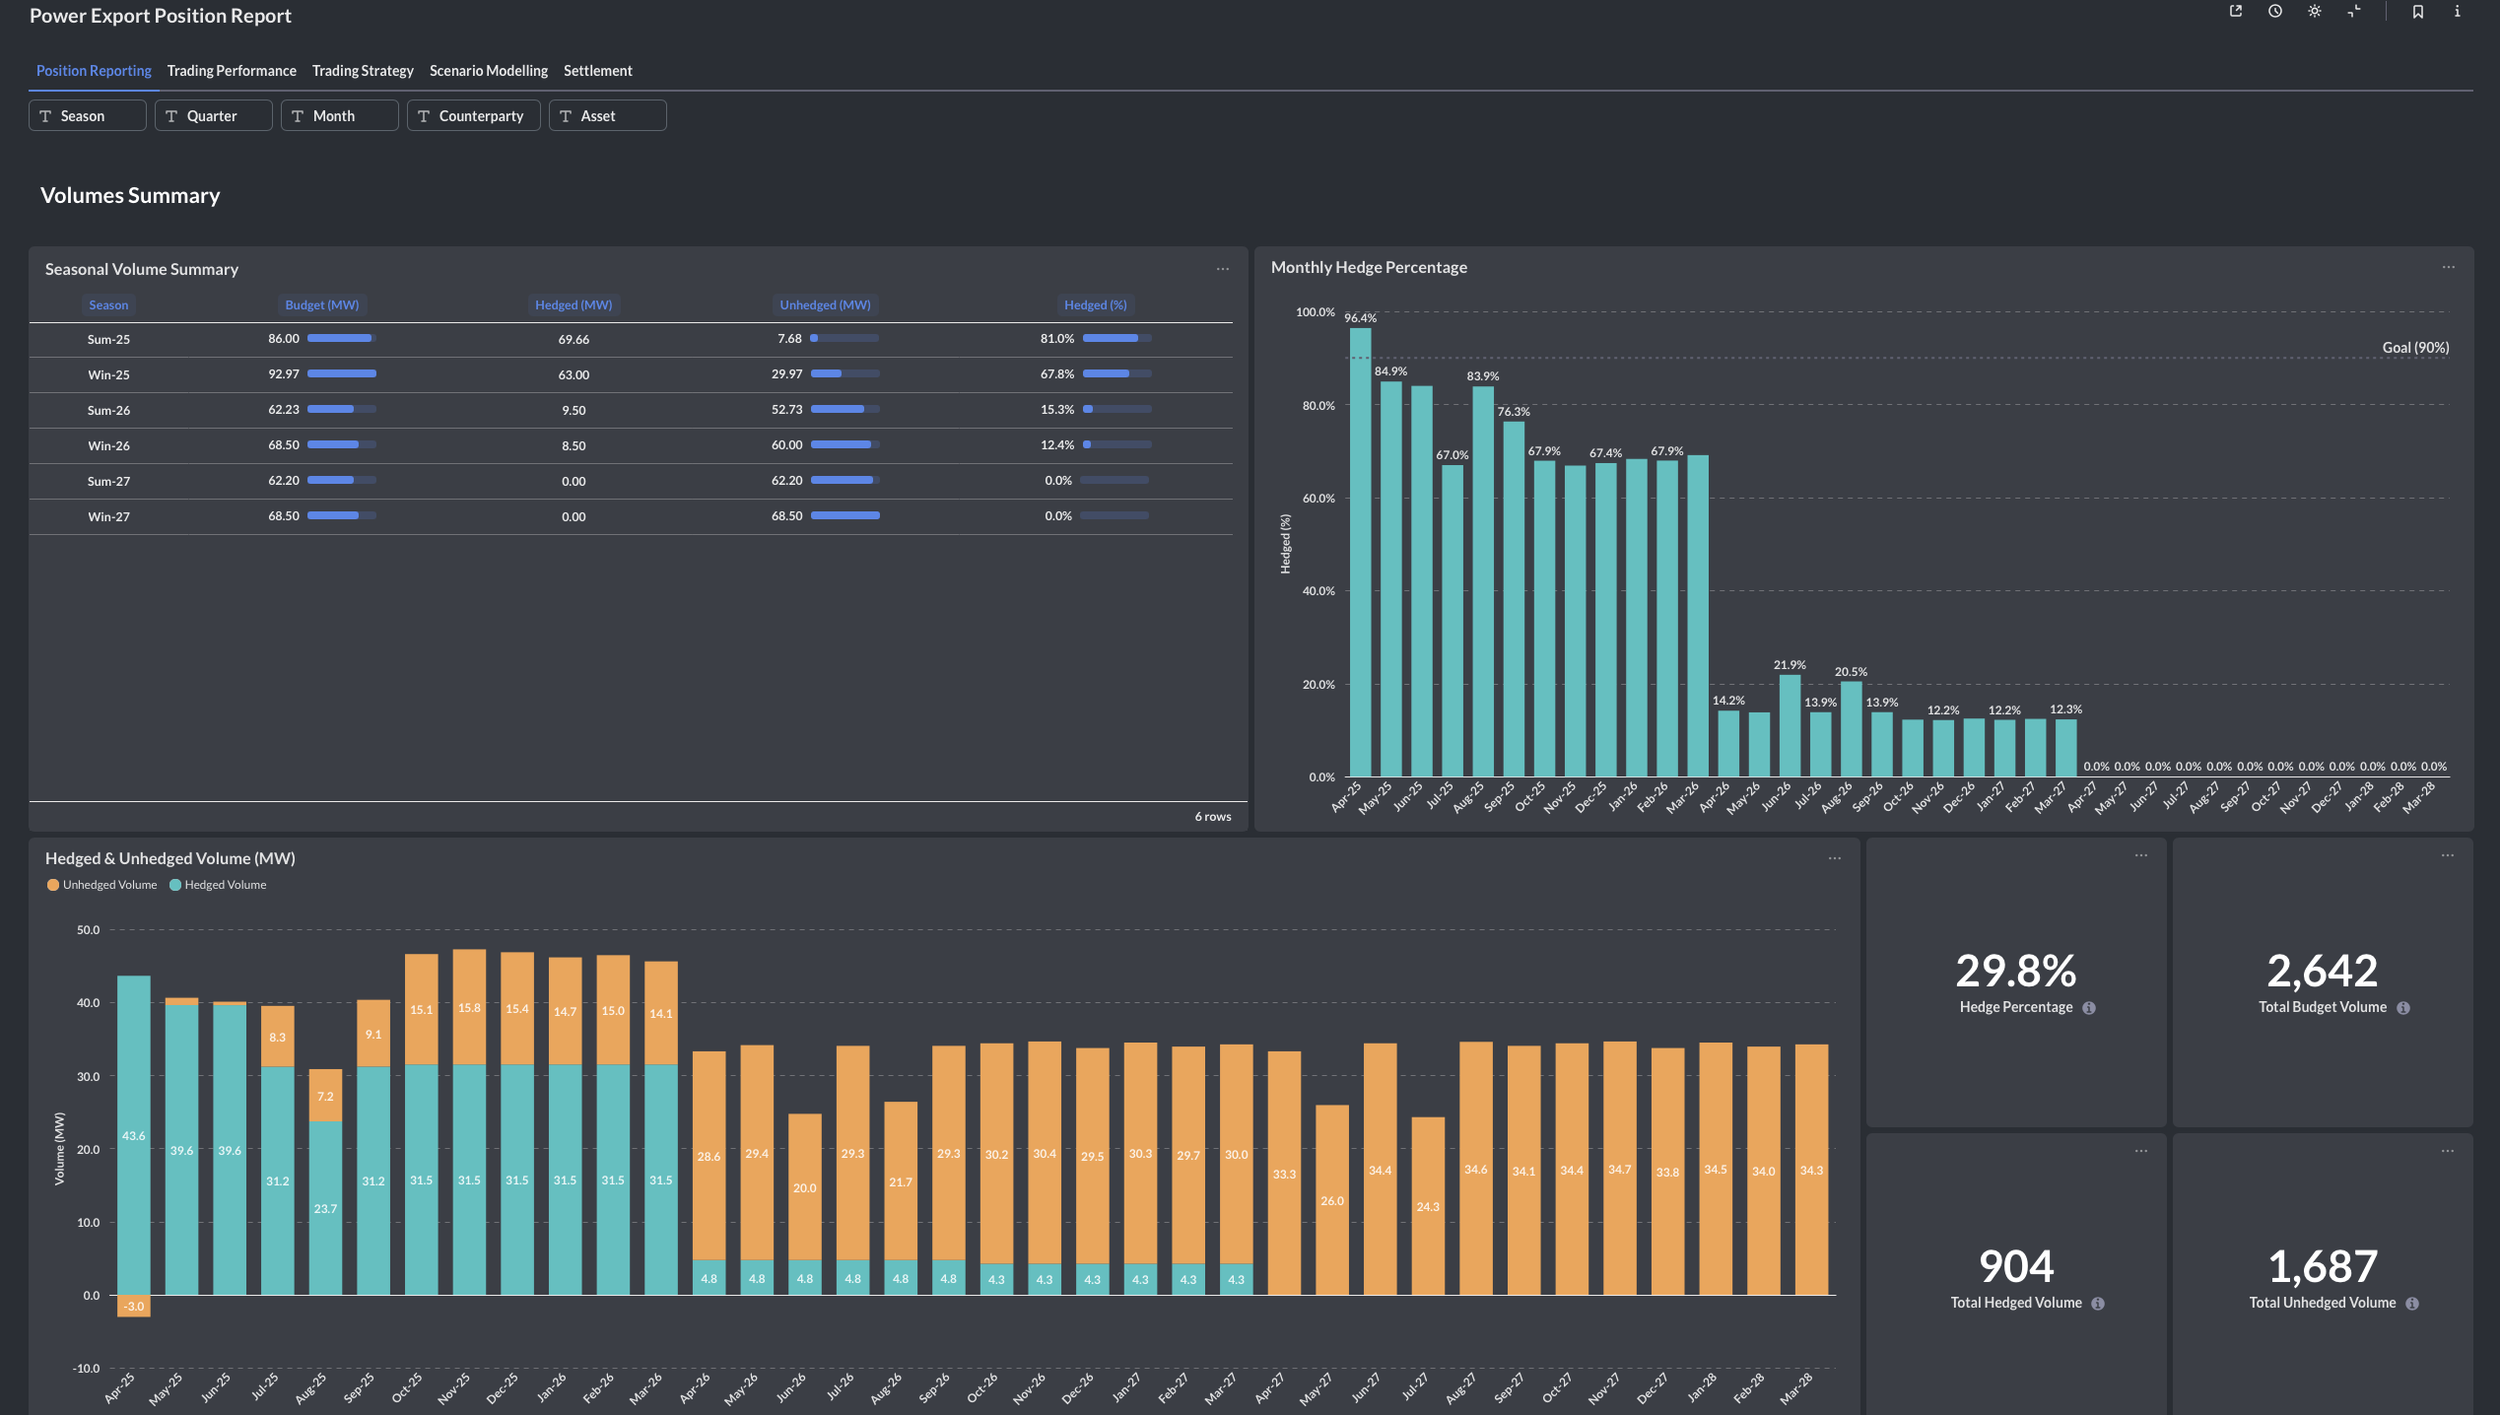
Position Reporting
Track portfolio performance and forecast future positions with real-time P&L attribution and risk analysis.
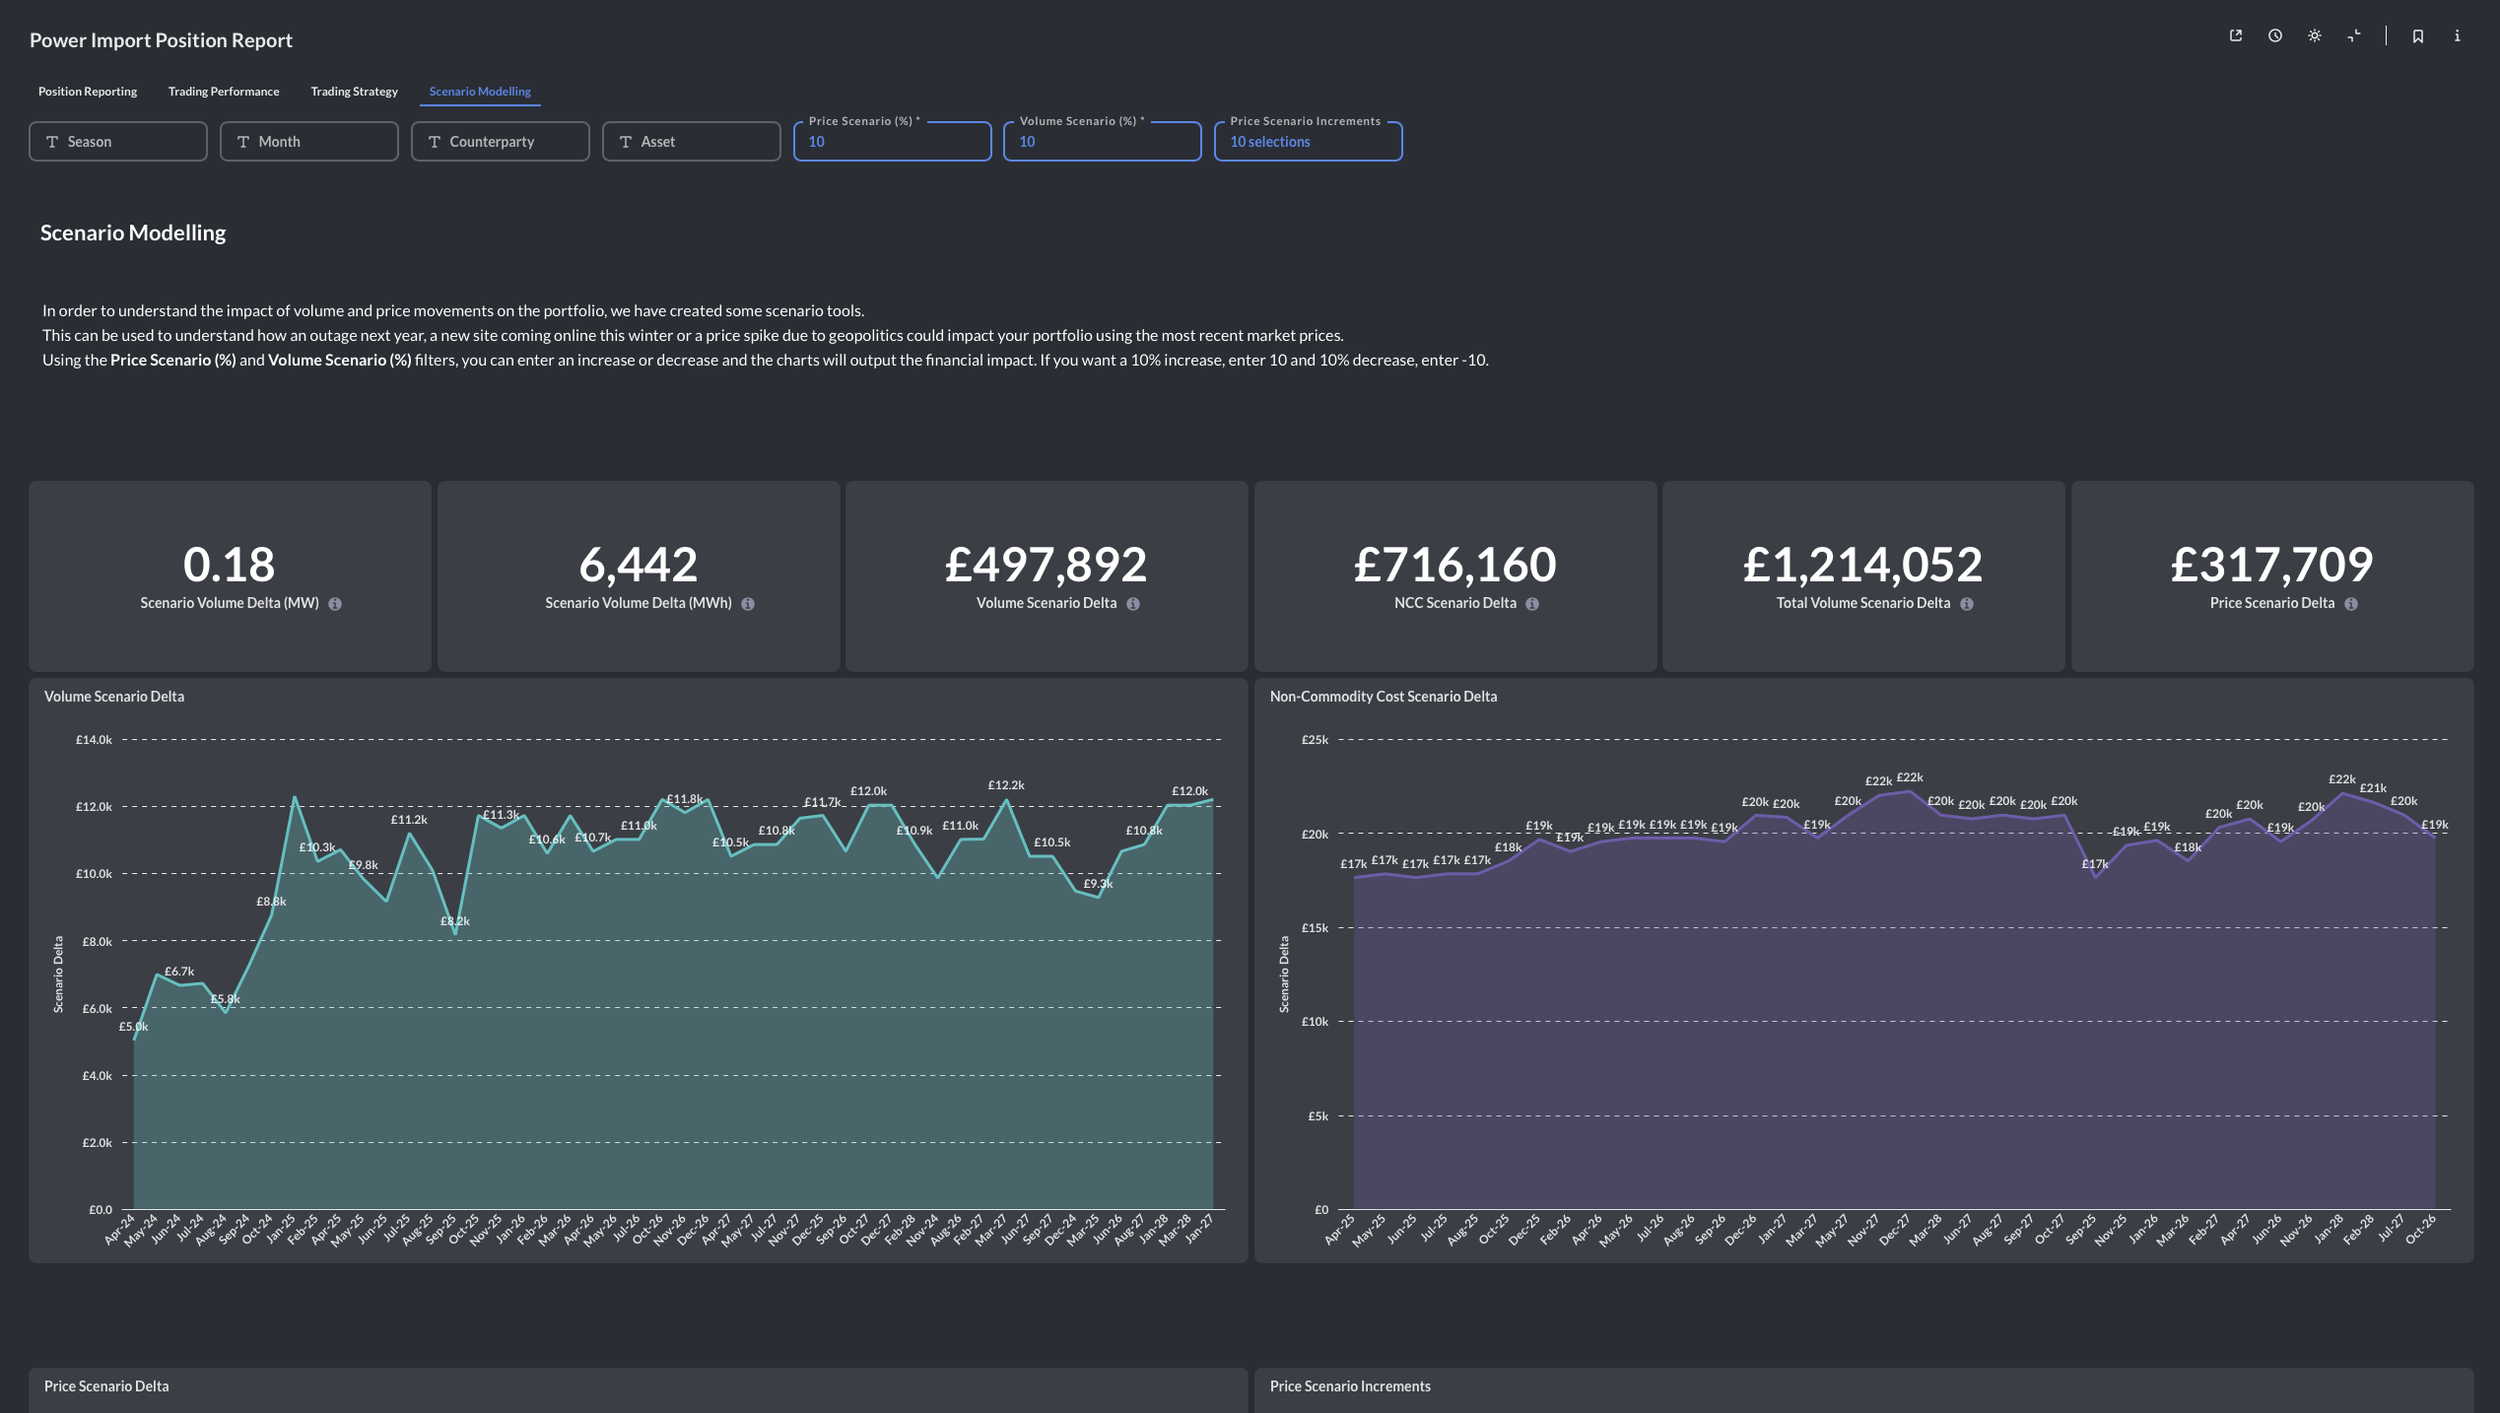
Scenario Modelling
Instantly model how changes to volume, price, and non-commodity costs will impact your business outcomes.
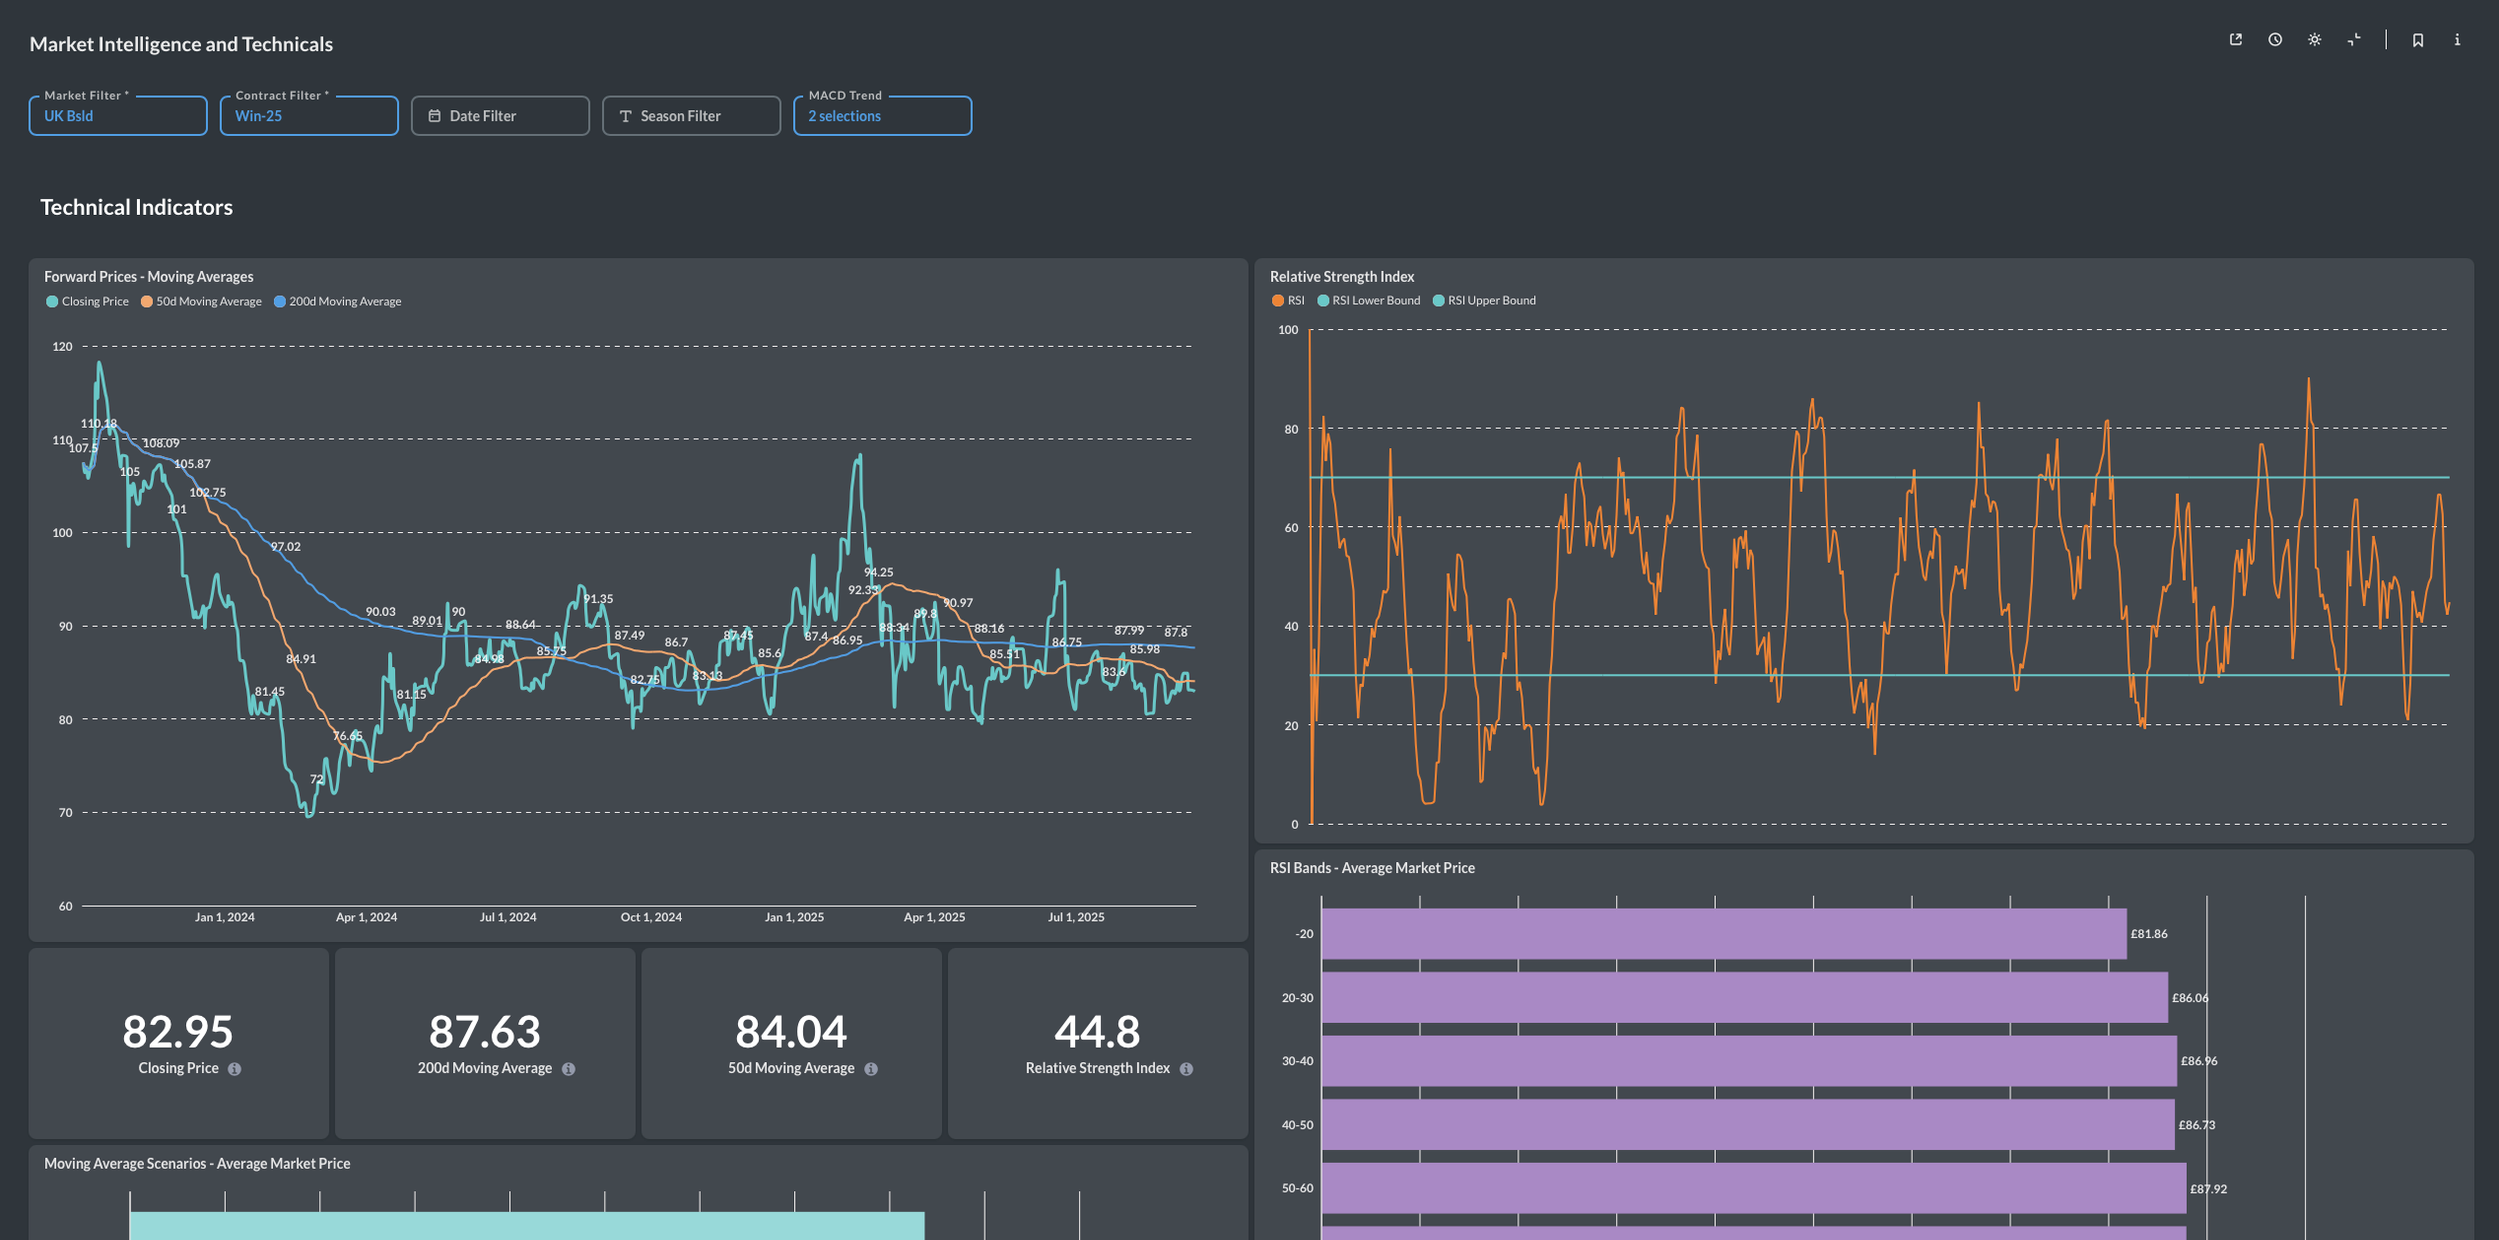
Market Intelligence & Technical Analysis
Access market data with technical indicators to inform trading decisions.
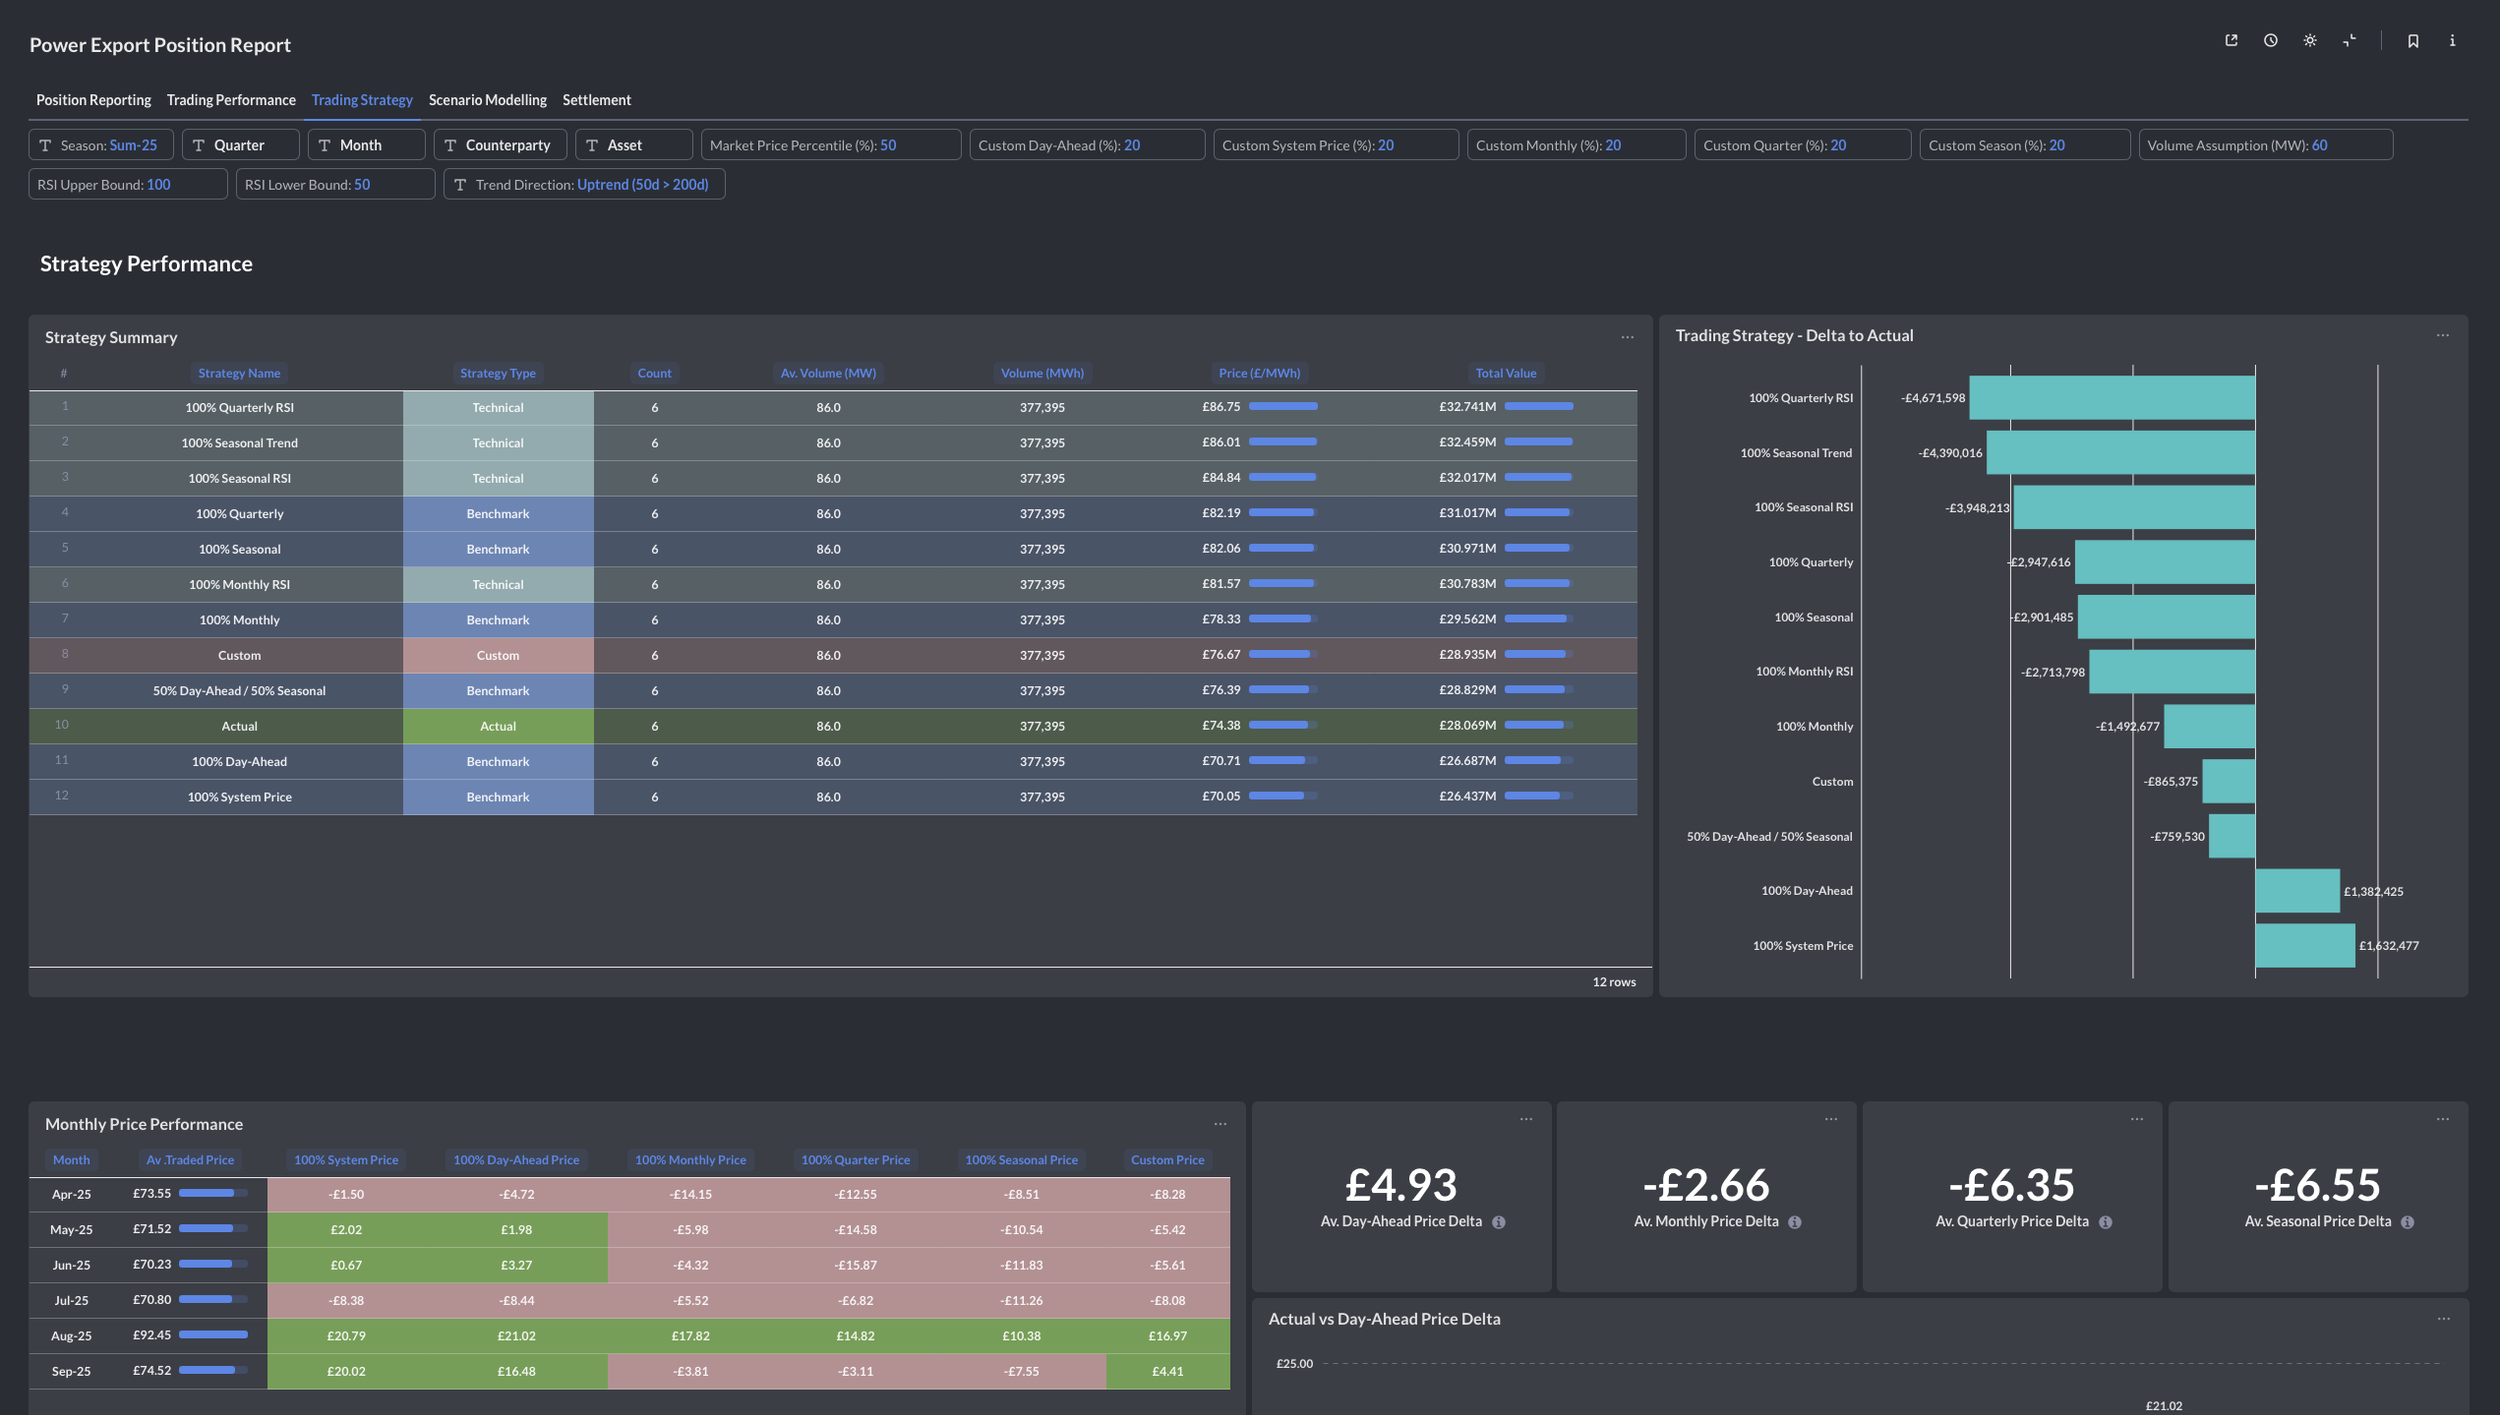
Strategy Benchmarking
Compare your trading performance against market benchmarks and identify optimisation opportunities.
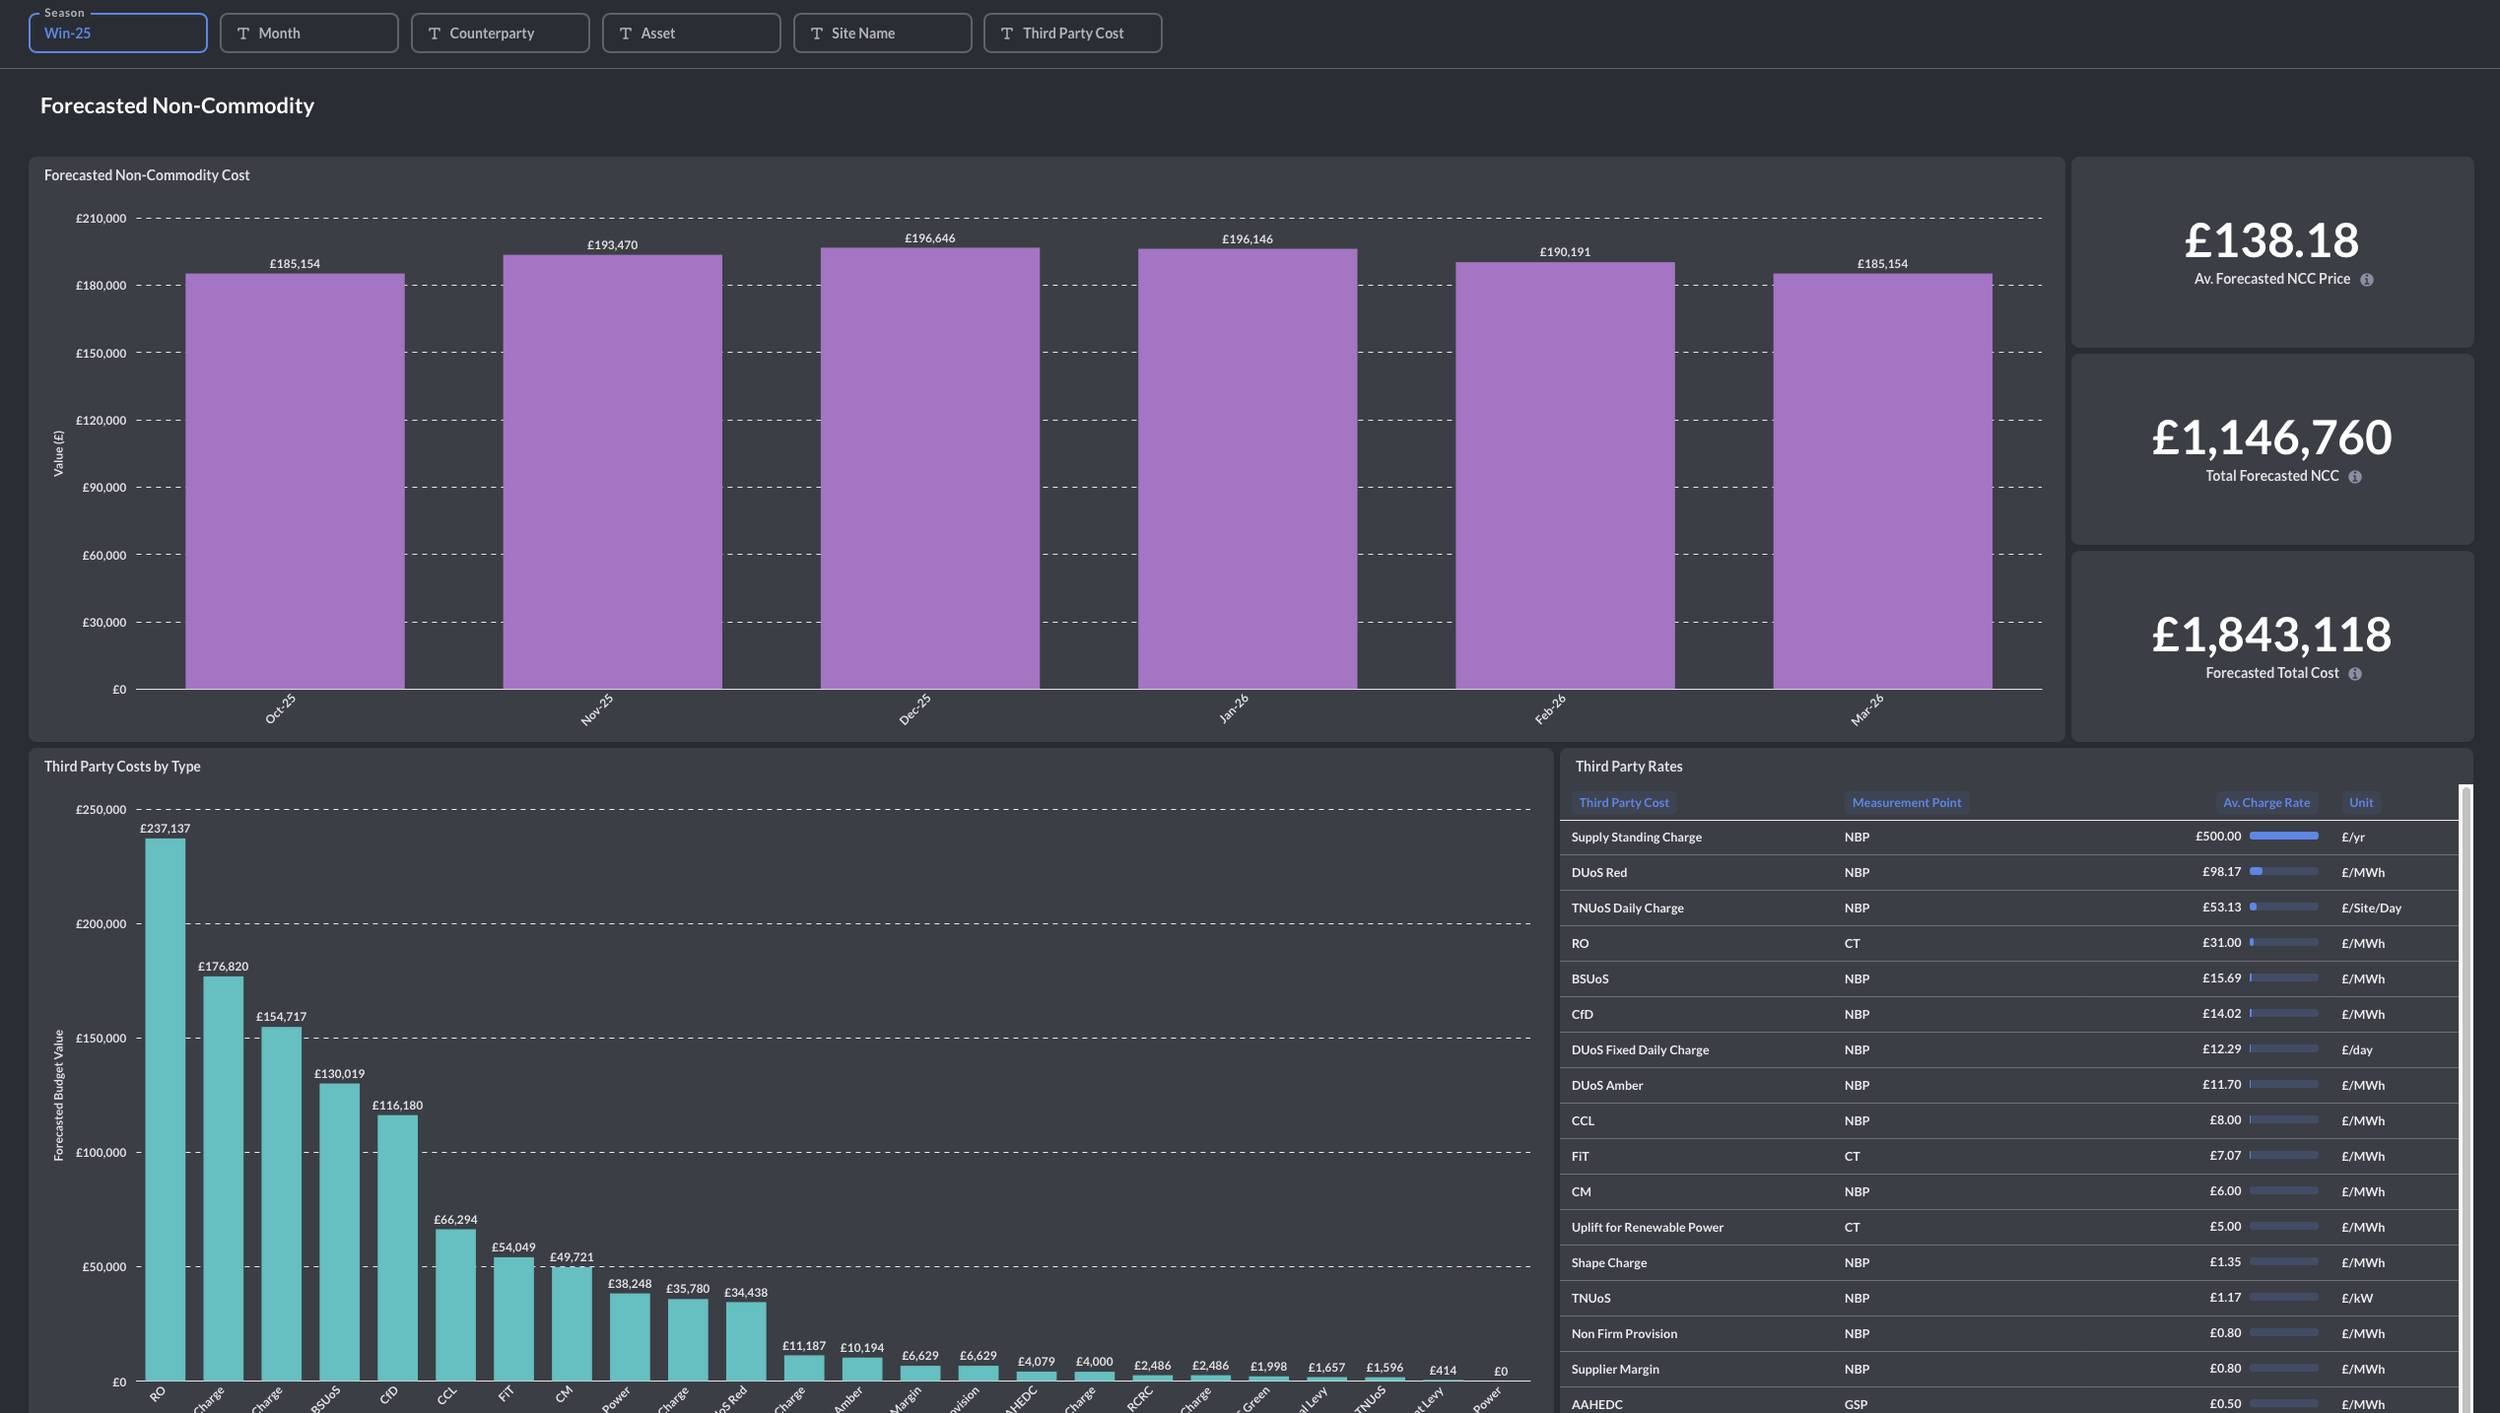
Non-Commodity Cost Forecasting
Get complete visibility into transportation, balancing, and other non-commodity costs.
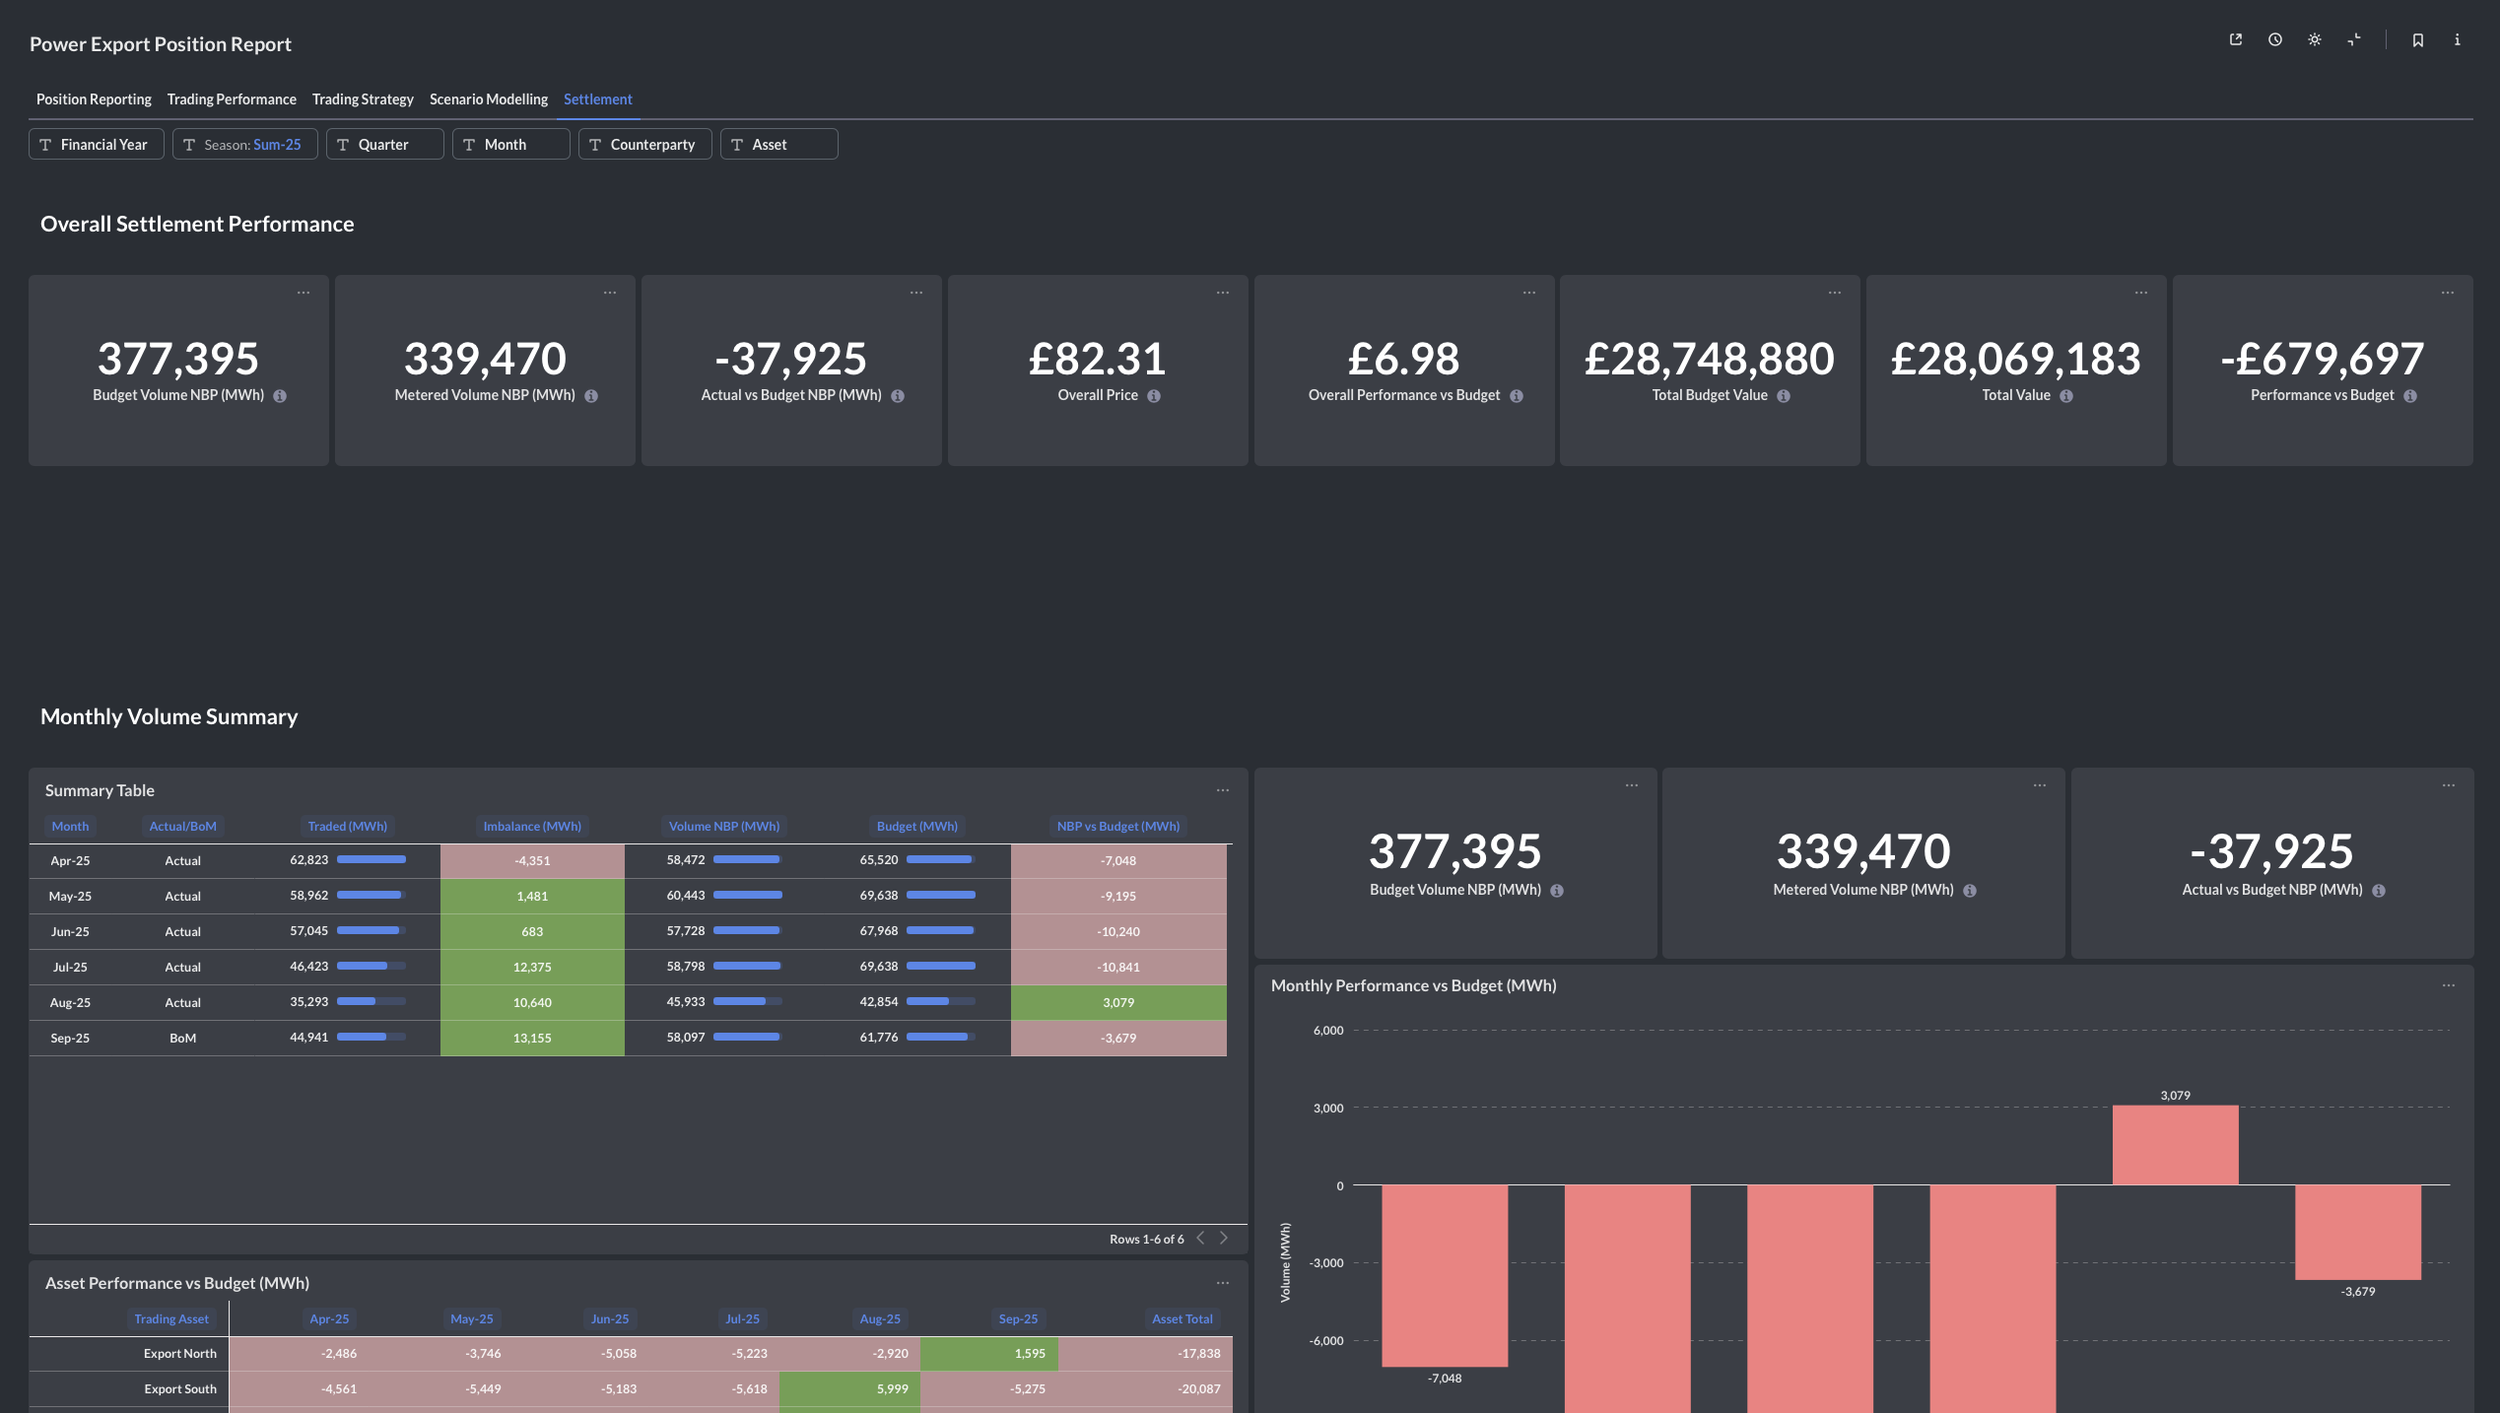
Settlement & Bill Validation
Automatically verify invoices, catch billing errors, and ensure accurate settlement across all contracts.
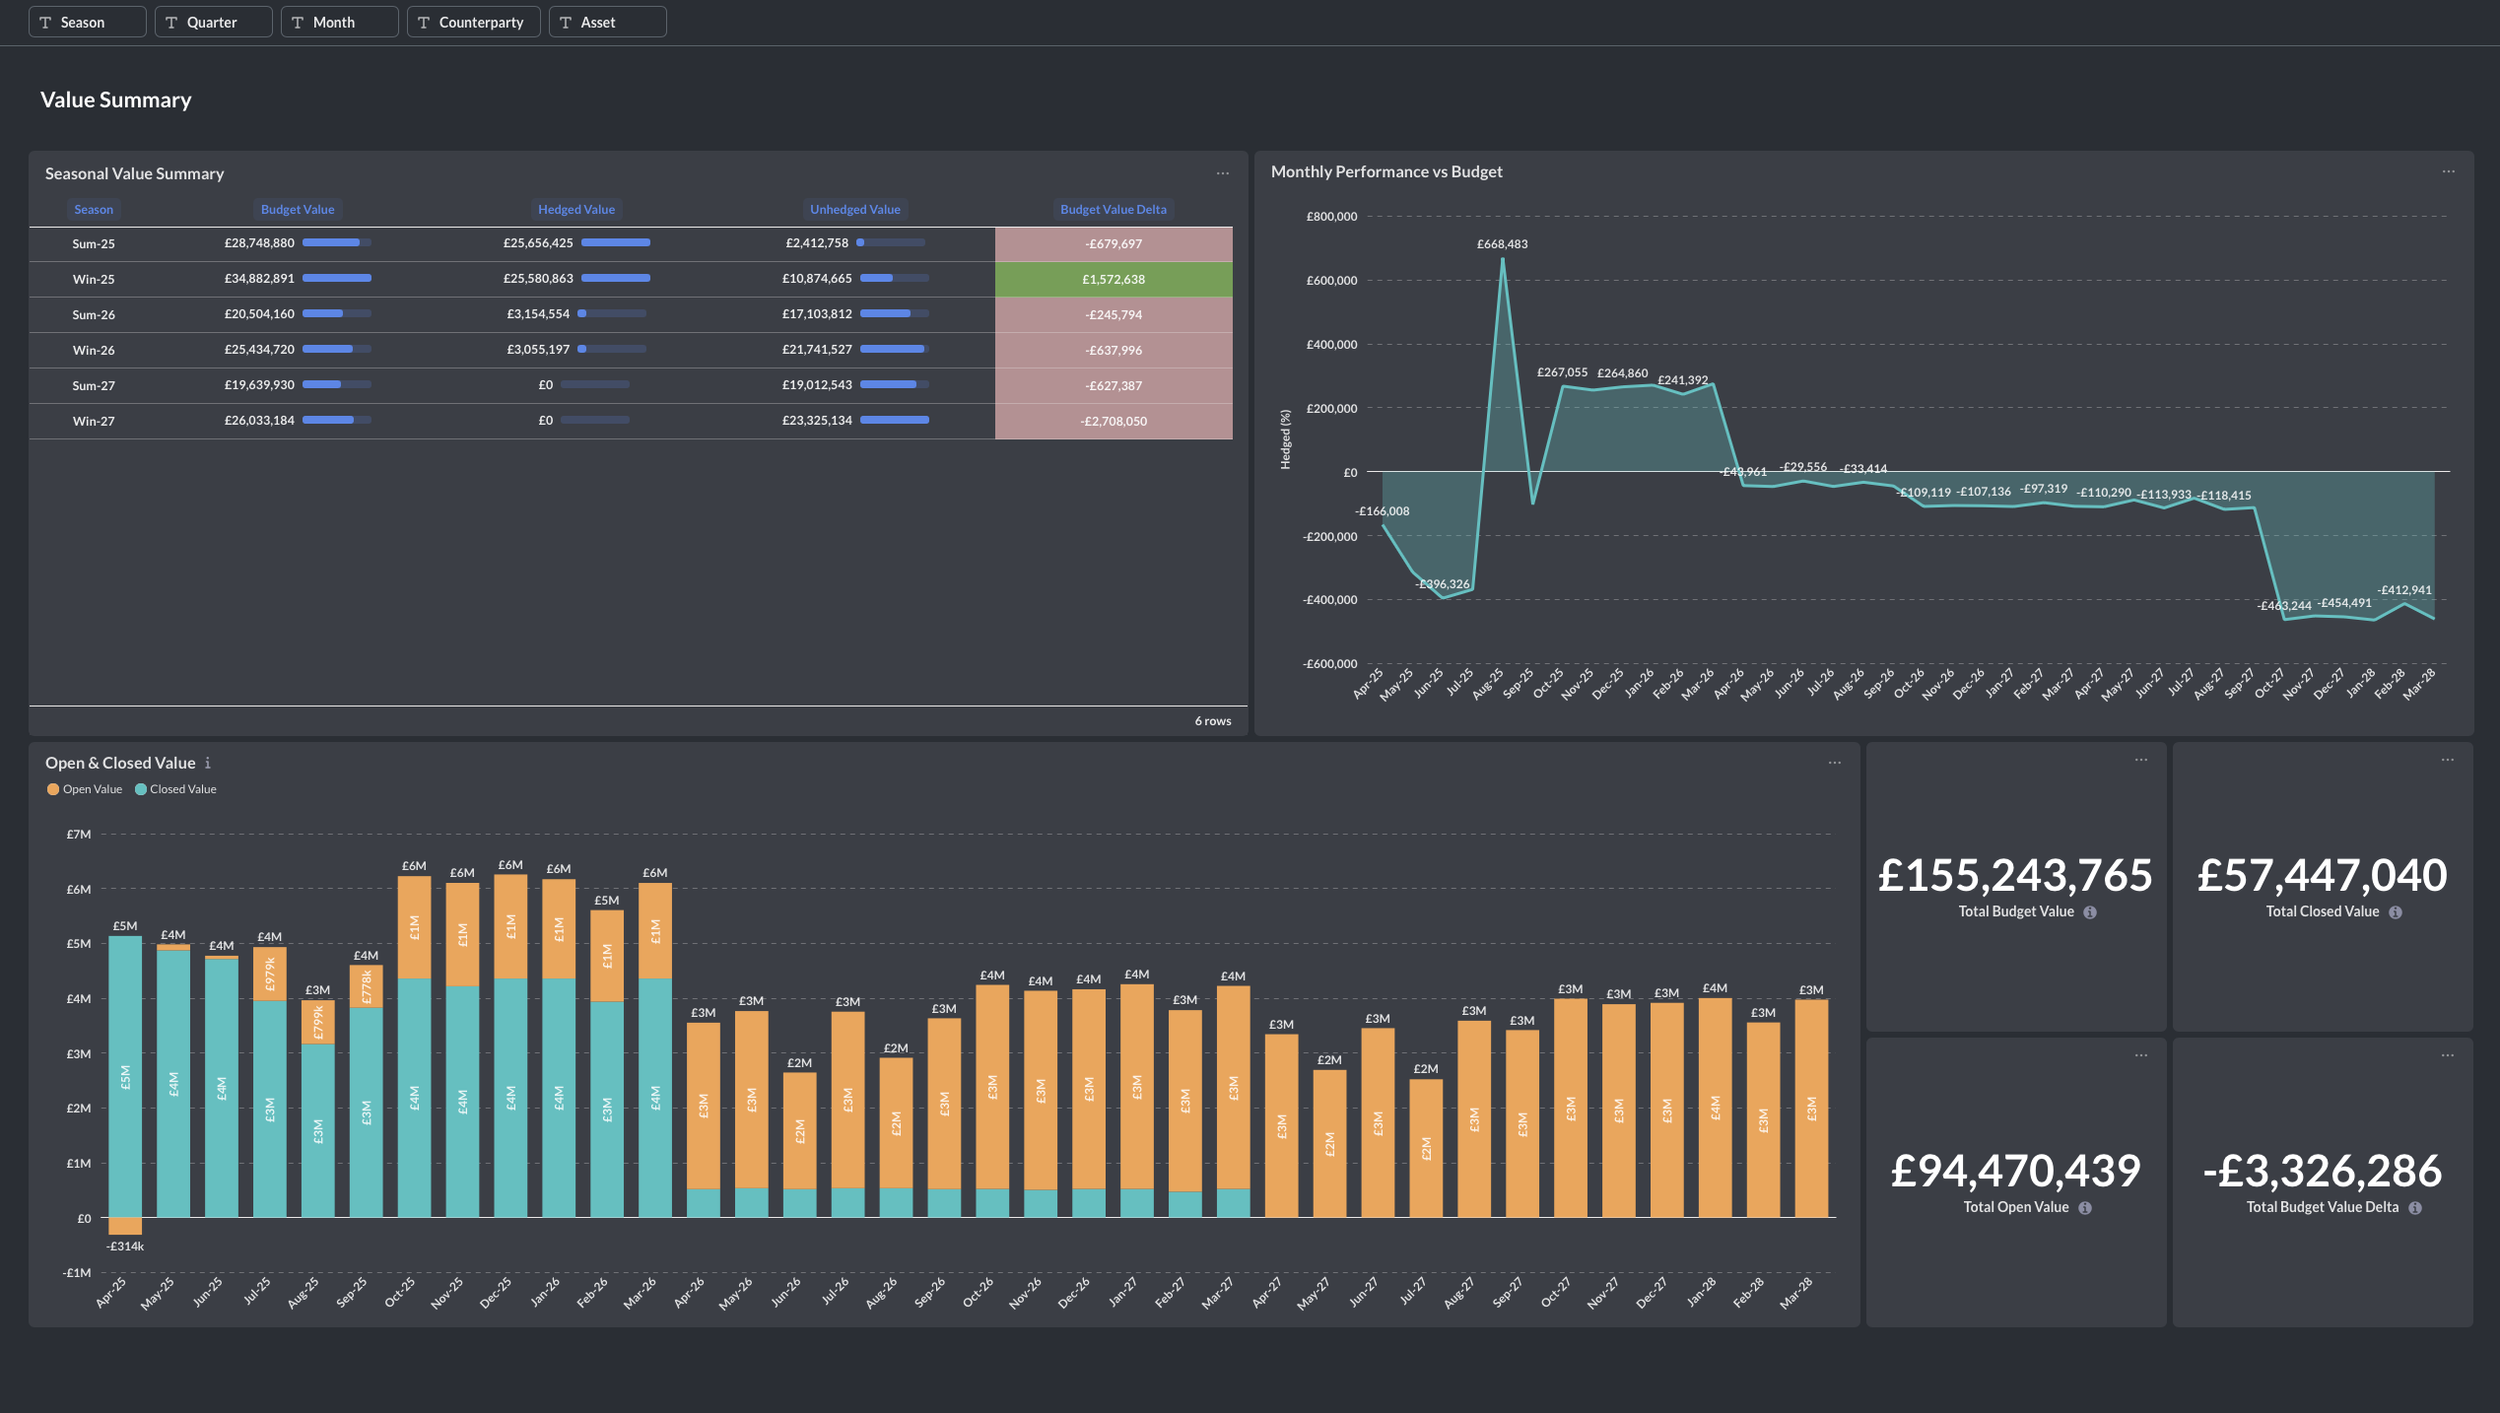
Financial Forecasting (BoM)
Forecast expected revenue streams and cash flows, enabling accurate accruals and financial planning.
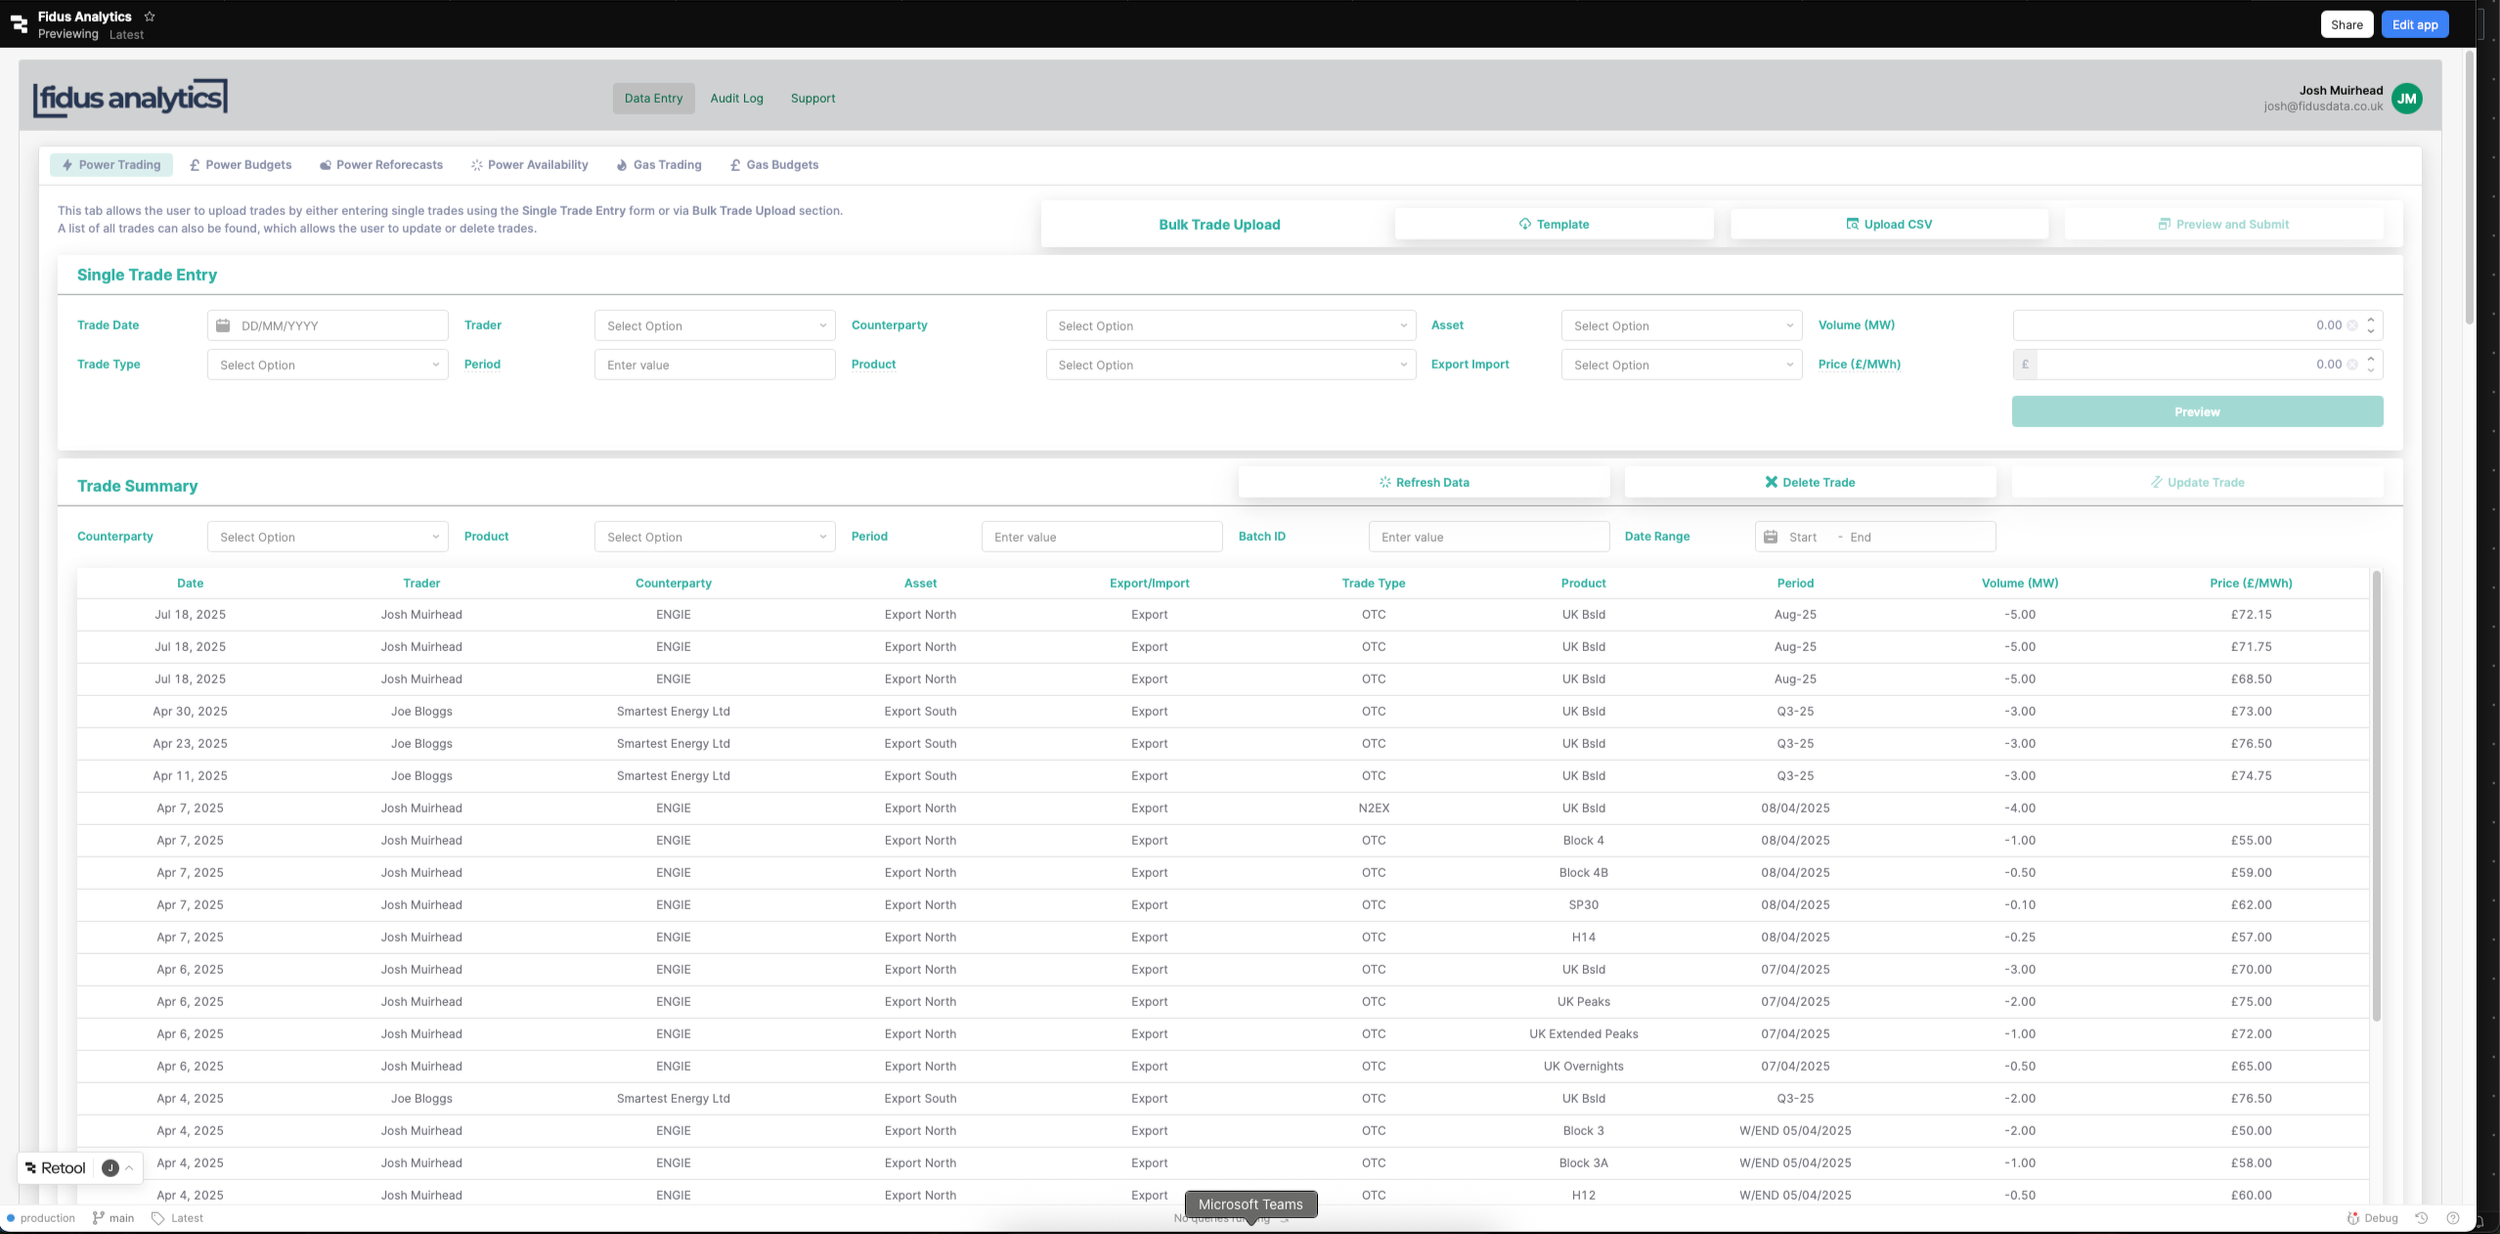
Custom Data Portals
Purpose-built interfaces for entering data that can't be automatically integrated from existing systems.

Built by Energy Experts
Developed by teams with real energy trading experience who understand your challenges.

Seamless Integrations
Export to Excel, connect with existing BI tools, or integrate with your current systems for extended analysis.
Every feature can be customised to match your specific workflows, data sources, and business requirements.
The Solution
Our analytics-first approach solves these problems in ways traditional software simply can't. Whether through our proven Spark platform or custom-built solutions, here's how we deliver exactly what your business needs.
Fully Managed Service
Focus on decisions, not data management. We handle all the technical complexity - data integration, server maintenance, updates, and monitoring - so your team can concentrate on analysis and strategy, not IT troubleshooting.
Custom-Built for Your Business
Every solution is tailored to your specific processes, data sources, and decision-making needs - no forcing your business to fit generic software templates.
Near Real-Time Intelligence
Your dashboards update automatically as new data flows in, giving you an always-current view of your portfolio performance, market positions, and trading opportunities.
Risk Elimination
Remove single points of failure, version control issues, and the operational risks that come with spreadsheet-based processes.
Analytics-First Approach
By treating this as an analytics challenge rather than a software implementation, we deliver solutions in weeks, not months. You get valuable insights while traditional platforms are still in planning phases.
Scalable Architecture
Start with what you need now, expand as you grow. Add new data sources, create additional dashboards, or build new analytical capabilities without starting over.
Imagine this with your data
In a free 30-minute session, we’ll explore your current processes and show how a tailored analytics solution could unlock hidden opportunities in your energy portfolio.